AI infrastructure spans multiple layers, from compute and networking to storage, orchestration, and applications. When performance degrades, identifying the source can be difficult because a symptom observed at one layer may originate elsewhere in the stack.
Official announcementNVIDIA Developer Blog
How to Choose Full-Stack Observability for NVIDIA AI Factories
AI infrastructure spans multiple layers, from compute and networking to storage, orchestration, and applications. When performance degrades, identifying the... AI infrastructure spans multiple layers, from compute and networking to storage, orchestration, and applications. When p

A full-stack observability strategy connects telemetry across these layers, helping infrastructure and operations teams detect problems, isolate their causes, and maintain reliable AI workloads. This post presents a practical observability framework for NVIDIA AI infrastructure and shows how to apply it to common monitoring and troubleshooting scenarios.
Consider a distributed training job that is three days into execution. GPU utilization and queue wait times remain normal. After six hours of reduced throughput, the team traces the cause to a single InfiniBand link drifting into an elevated bit error rate.
This is a classic gray failure. The hardware is degraded, but the system does not report it as “down.” AI training follows the bulk synchronous parallel (BSP) model. These tightly coupled systems are sensitive to stragglers: one slow rank holds back the job. Link-level retransmissions stall a single rank during synchronous collective operations such as NVIDIA Collective Communications Library (NCCL) all-reduce. Throughput then falls to the slowest rank, and the other ranks block. That is a cascading failure.
You see this failure mode often in AI factories. The required telemetry typically already exists; the challenge is selecting the right signals from the right tools early enough to act. Operators do not need every metric from every product. They need a decision path that maps components to tools, tools to a concise alert set, and that alert set into a single triage dashboard.
This post shows that path. You will learn how to:
- Enumerate the failure domains that must be observable before selecting software.
- Map AI infrastructure components to telemetry tools sources using a decision framework derived from NVIDIA DGX deployments.
- Apply the observability framework to an InfiniBand cluster.
- Reduce telemetry to a top-k alert set and correlate signals in a single triage dashboard.
Keep detailed catalogs, protocol matrices, and per-tool enablement guides in product documentation. Here, you’ll focus on how to choose an observability stack. NVIDIA DGX and NVIDIA HGX deployments share the same observability surface, even when hardware configurations differ (Figure 1):
Identify AI factory failure domains[](#identify_ai_factory_failure_domains)
Figure 1. AI factory architecture
Related stories

Official announcement
Giga-Scale AI and the Ethernet Evolution: How Spectrum-X Ethernet Rewrites the Rules
NVIDIA Developer Blog
The massive growth of generative AI has fundamentally altered data center design. As distributed model training scales to span hundreds of thousands of GPUs,... The massive growth of generative AI has fundamentally altered data center design. As distributed model training scales

Official announcement
How AI Coding Agents Can Unlock Materials Simulation with NVIDIA ALCHEMI Toolkit
NVIDIA Developer Blog
Atomistic simulation requires three things: knowledge of the science, compute-efficient implementation of simulations, and accessible interfaces to the... Atomistic simulation requires three things: knowledge of the science, compute-efficient implementation of simulations, and ac

Official announcement
How we saved 100 terabytes of memory by optimizing 1.1.1.1’s DNS cache
Sebastiaan Neuteboom
Big Pineapple , the platform behind 1.1.1.1 , Gateway DNS , DNS Firewall , AS112 , and several other Cloudflare DNS services, stores over 250 billion DNS cache entries at any given time. At that scale, wasting a single byte per entry costs more than 250 gigabytes of memory across
Official announcement
Managed PostgreSQL vs. self-hosted PostgreSQL: Key benefits and trade-offs
Lauro Ojeda
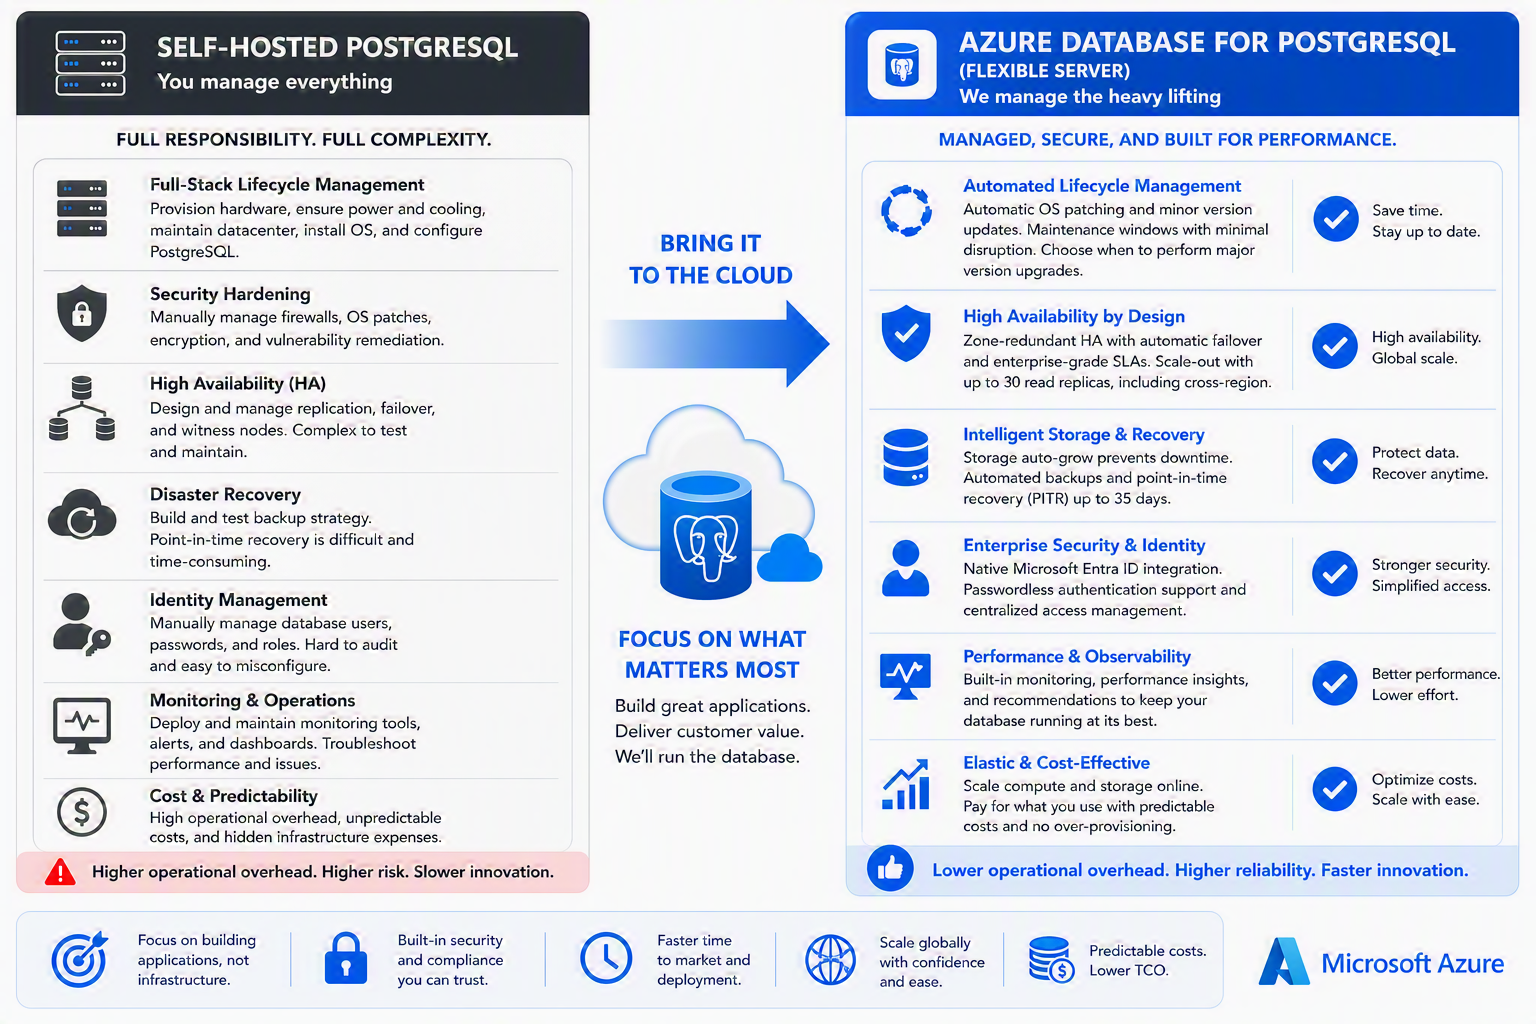
Summary This post is for technical decision makers evaluating where to run production PostgreSQL workloads. It compares two valid operating models—self-managed PostgreSQL and a managed database service—through business and operational outcomes: control, engineering capacity, resi

Official announcement
OpenClaw went viral. Meet the maintainers building and securing it.
Gregg Cochran
What began as a personal experiment quickly became a global open source project with extraordinary momentum. OpenClaw is a personal AI assistant that runs on users’ devices and connects with the messaging channels they already use. Started by Peter Steinberger as a weekend projec

Official announcement
IBM Brings AI-Powered US Open Fan Experience Back to Madison Square Park
IBM Newsroom
Join IBM for AI-powered tennis activations, live US Open match viewing, giveaways and more during Championship Weekend